Almotasim KhairullahAlmotasim

Web developer and data analyst

From the idea to something that runs

We are the vision of 2030

Portrait of Almotasim
I

The work

01

Sales Analytics Challenge

Year
2025
Project Type
Competition
Stack
Python, Power BI, Excel

A LinkedIn data-analysis tournament: find the top 3 products overall, and the top product in each city.
04

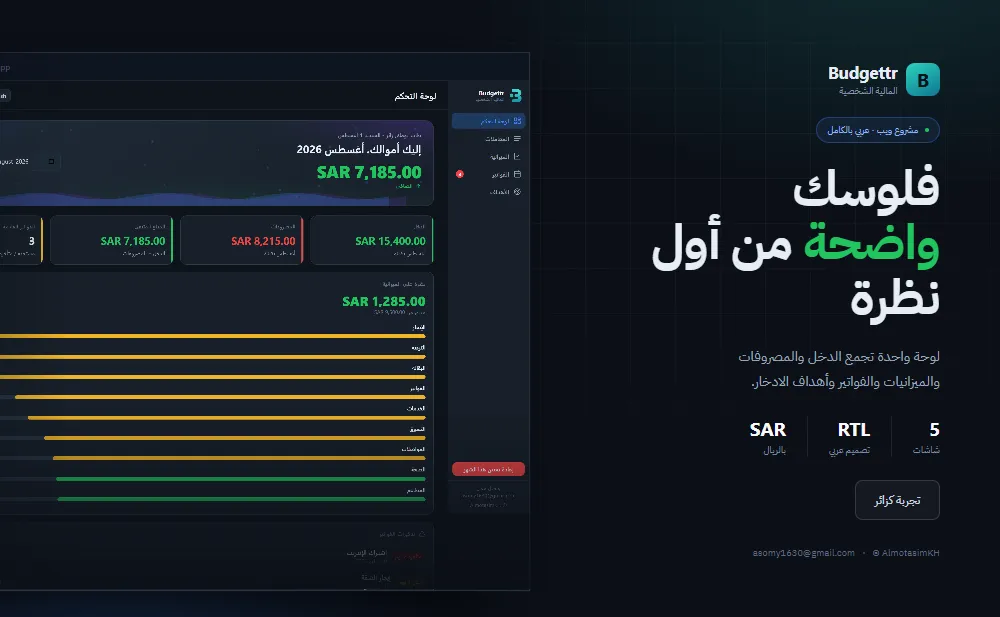
Budgettr

Year
2026
Project Type
Personal Project
Status
Live
Stack
React, TypeScript, PostgreSQL, Tailwind

A dashboard that organises your spending at the start of every month, so you have a clear view of where it goes and a record you can go back to.

05

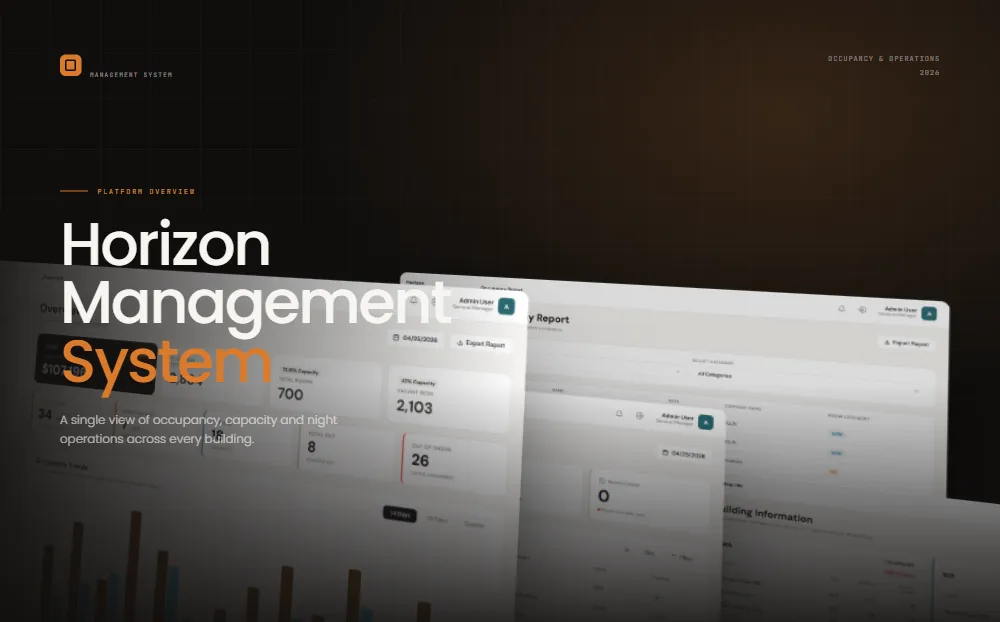
Management System

Year
2026
Project Type
Internal Work
Stack
Full-Stack, UI/UX

A single view of occupancy, capacity and night operations across every building.

06

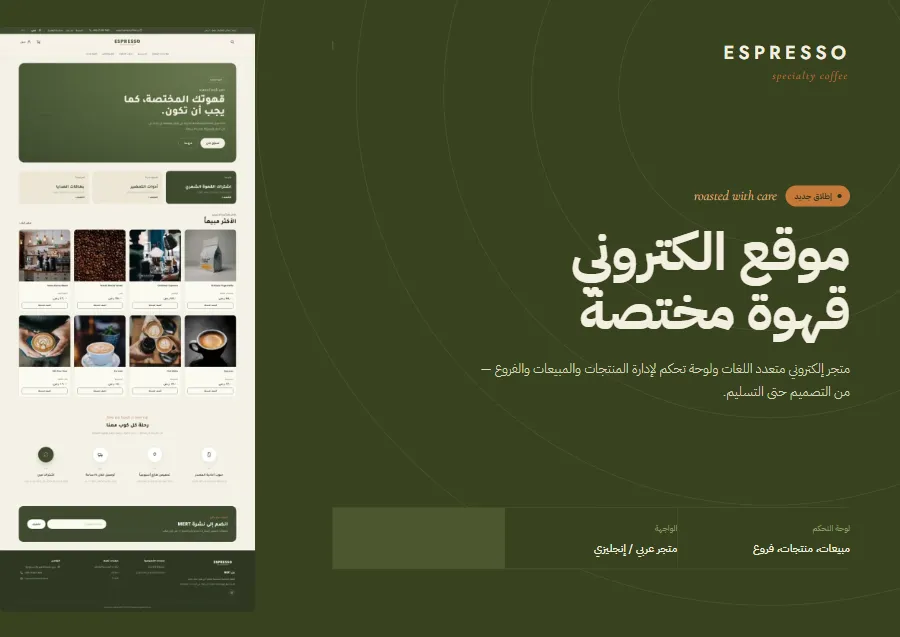
Coffee Shop Website

Year
2026
Project Type
Client Work
Status
Built, not launched
Stack
Full-stack, Database, Docker, UX/UI

A specialty-coffee storefront with the admin panel that runs it.

II How I work

Half builder half analyst

I'm currently working and studying, and I've chosen technology as my path.My journey started between work, study, and courses, then it grew into freelance work and personal projects.

My goal is to build something useful that serves people and makes their experience easier, through technology and AI.

In the 21st century, if you know how to use the tools the right way, with the right thinking, you'll end up with a product that looks like you.

  • UI / UX Design
    Figma, design systems, prototyping
  • Data Analysis
    Python, SQL, Power BI
  • Web Development
    React, APIs, full-stack
  • Excel
    Modelling, automation, dashboards
  • AI
    Claude, prompt design, automation
III The record

Work journey

2026
Freelance full-stack, Coffee Shop Website

A storefront and admin dashboard built end to end: Node.js and SQL behind it, React and TypeScript in front, packaged with Docker. Not launched; the build stopped at the payment and delivery APIs, which are on the client side.

2025
Revenue dashboards, Power BI

Twelve-plus internal Excel sources folded into one Power BI view: Python for the prep, Figma for the layout. The 2025 rebuild added average performance rates and faster drill-down.

2025 - now
Front Desk Group Leader, Namariq

Lead the front desk team and own the daily operational reports that other departments rely on in their decision-making.

2024
YCATThon participant

4th place out of 44 teams. The hackathon ran across several sectors; I entered the tourism track.

2023 - 2025
Front Desk Clerk, Namariq

Handled guest and visitor services, managed reservation correspondence, responded to emails, and performed night audit operations.

2023 - 2025
UI/UX Designer

Designed wireframes, web interfaces, and mobile applications for clients using Figma.

2018 - 2023
Assorted work
IV

KPIs

Six figures, each one from a project on this page.

  • 12 Excel sources merged into one dashboard Source Revenue Analysis 2024
  • 60 min → 1 min Time to find one revenue number Source Revenue Analysis 2024
  • 1 hr Manual reporting saved every morning Source Camp Operations Dashboard
  • 27 People using one platform I shipped Source Budgettr
  • 4th /44 Teams at YCATThon, tourism track Source YCATThon 2024
  • ~300 Participants in the LinkedIn data challenge Source Sales Analytics Challenge

Let's build something
worth shipping.

Asomy1630@gmail.com

LinkedIn ↗ GitHub ↗ Usually replies within 1-2 days

© 2026 Almotasim Khairullah